Here’s some fun and wild maths for a Friday evening.  Feel free to ignore everything in this post, even though it’s based on actual data with added wild speculation on top :D.
It's madness below here
I just dug up some historical data (I am a data packrat) . I can’t reveal the source, sorry. In 2019, a very, very popular generic app used by nerds and normal people alike had this proportion of installs:
| Distribution |
Percentage |
| Ubuntu 18.04.2 LTS |
27.2% |
| Ubuntu 16.04.6 LTS |
10.1% |
| Linux Mint 19.1 |
5.6% |
| Ubuntu 18.04.1 LTS |
5.5% |
| Ubuntu 16.04.5 LTS |
~4.7% |
| Linux Mint 18.3 |
~4.2% |
| Ubuntu 19.04 |
~3.8% |
| Linux Mint 19 |
~3.3% |
| Debian GNU/Linux 9 (stretch) |
~2.8% |
| Ubuntu 14.04.5 LTS |
~2.3% |
| Ubuntu 18.10 |
~2.0% |
| Ubuntu 16.04.3 LTS |
~1.8% |
| Ubuntu 16.04.4 LTS |
~1.5% |
| Arch Linux |
~1.5% |
| Manjaro Linux |
~1.2% |
| Ubuntu 14.04.6 LTS |
~1.0% |
| Remaining distributions |
~22.5% |
Note: All percentages after the first four are approximations based on visual interpretation of a graph, not raw data. The remaining distributions (adding up to roughly 22.5%) each represent less than 1% of the total and include various versions of Fedora, elementary OS, Deepin, openSUSE, other Ubuntu versions, KDE neon, Gentoo, and Kali Linux.
Back then I had access to some other data sources, and was able to corroborate some of this. The hand-wavy numbers are in the right ball-park, based on the data I saw.
Let’s do some aggregation:
First, we can aggregate the distributions by their base family:
| Distribution Family |
Total Percentage |
Breakdown |
| Ubuntu |
~56.9% |
18.04.2 LTS (27.2%), 16.04.6 LTS (10.1%), 18.04.1 LTS (5.5%), 16.04.5 LTS (4.7%), 19.04 (3.8%), 18.10 (2.0%), 16.04.3 LTS (1.8%), 16.04.4 LTS (1.5%), 14.04.6 LTS (1.0%) |
| Linux Mint |
~13.1% |
19.1 (5.6%), 18.3 (4.2%), 19 (3.3%) |
| Debian |
~4.3% |
Debian 9 Stretch (2.8%), Debian 8 Jessie + Debian 10 Buster (~1.5%) |
| Arch-based |
~2.7% |
Arch Linux (1.5%), Manjaro (1.2%) |
| Fedora |
~2.5% |
Various Workstation Editions (27-30) |
| elementary OS |
~1.8% |
elementary OS 5.0 Juno + 0.4.1 Loki |
| openSUSE |
~1.5% |
Leap + Tumbleweed versions |
| Other |
~17.2% |
Including KDE neon, Gentoo, Kali, Deepin, CentOS, and others |
Some interesting observations:
- Ubuntu and its direct derivatives (including Mint) account for about 70% of all installations
- Debian and Debian-based distributions (including Ubuntu and its derivatives) represent over 74% of all installations
- Rolling release distributions (like Arch, Manjaro) make up a relatively small percentage
- The “Other” category shows significant fragmentation in the Linux ecosystem, with many distributions having small but dedicated user bases
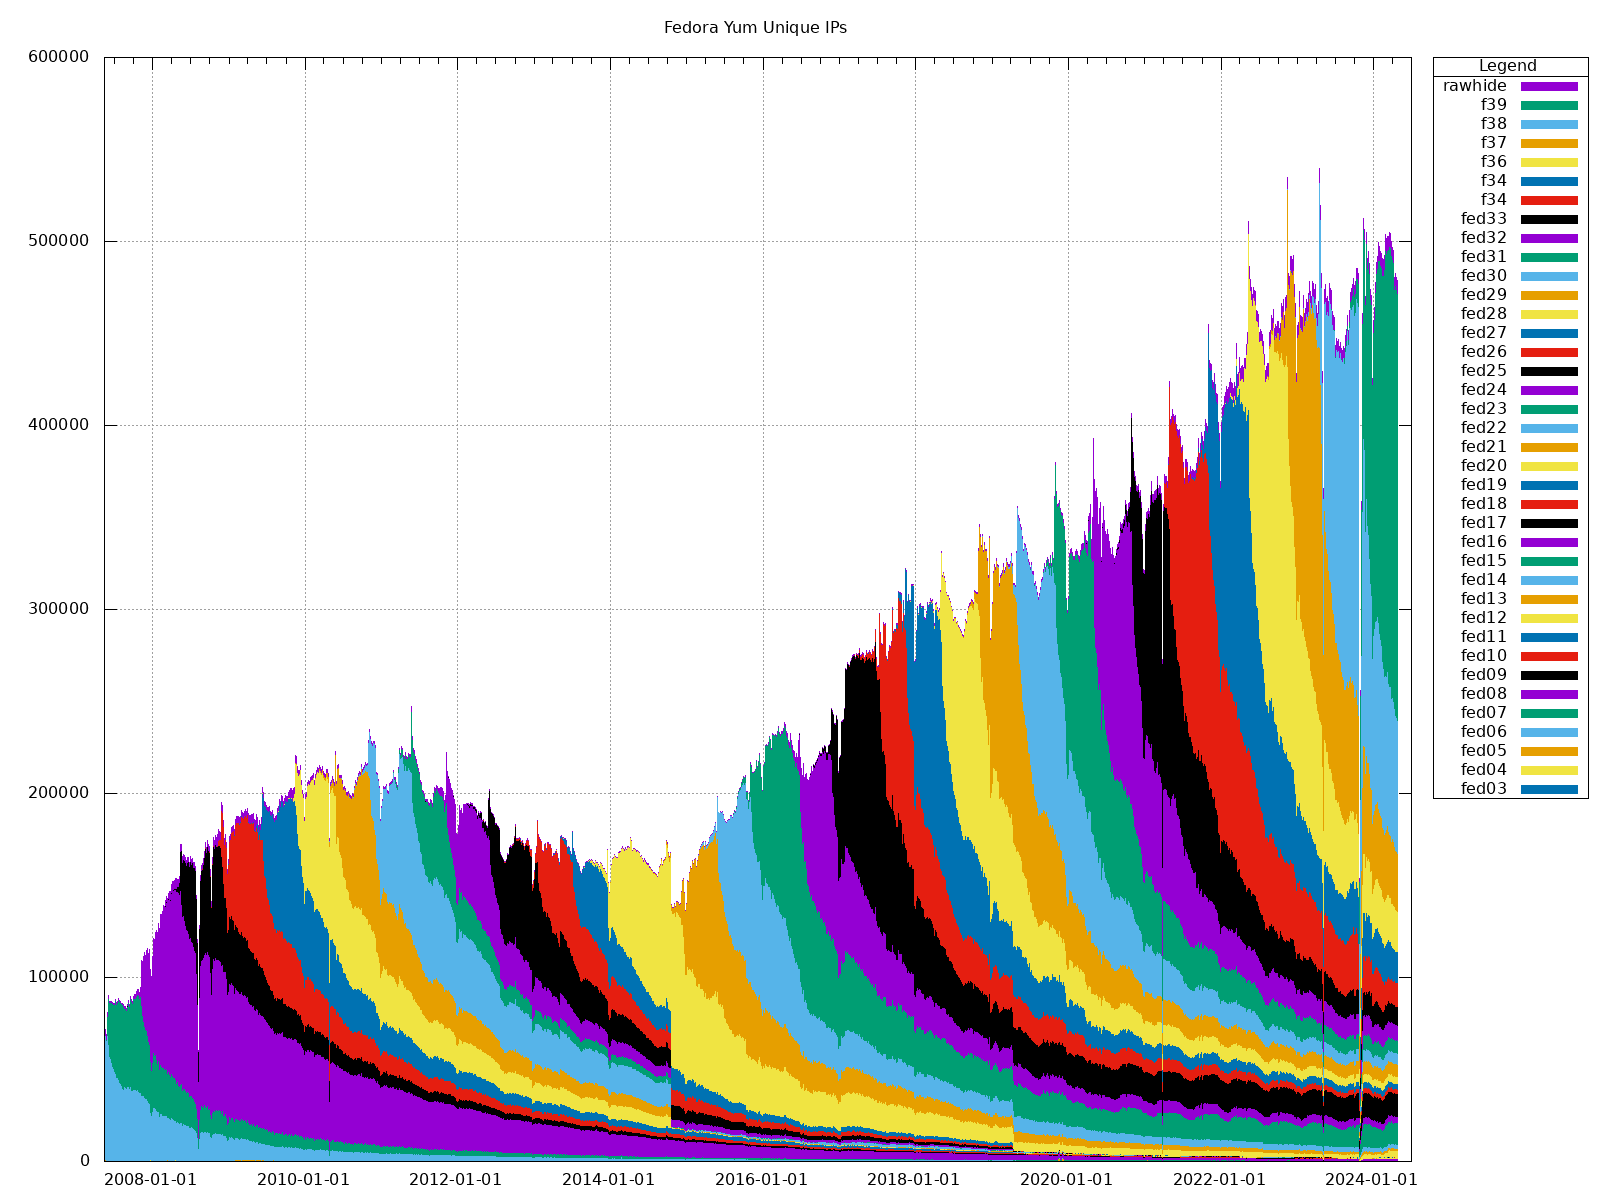
Now for the madness. Let’s take the graph @nikodunk just posted, and use the (estimated) numbers for contemporary Fedora releases, and wildly extrapolate to the other percentages.
- Looking at Fedora in the graph around May 2019:
- Fedora 29/30 appears to be around 300K unique IPs
- From our previous analysis, Fedora represented ~2.5% of the total Linux distribution share
- If we use this as a reference point, we can attempt to approximate total numbers:
- If 300K = 2.5%, then 100% would be approximately 12 million unique IPs
Let’s wildly plug numbers in and calculate the approximate numbers for the major distributions based on our previous percentages:
| Distribution |
Percentage |
Estimated Unique IPs |
| Ubuntu (all versions) |
56.9% |
~6.8M |
| Linux Mint |
13.1% |
~1.6M |
| Debian |
4.3% |
~520K |
| Arch-based |
2.7% |
~320K |
| Fedora |
2.5% |
~300K (our reference point) |
| elementary OS |
1.8% |
~220K |
| openSUSE |
1.5% |
~180K |
| Other |
17.2% |
~2.1M |
However, I should note several important caveats:
- The Fedora numbers are from Yum unique IPs, which might not directly correlate with actual installations
- Different distributions might have different reporting mechanisms
- Some users might disable reporting
- IP addresses can change, leading to overcounting
- NAT and shared IPs can lead to undercounting
Now let’s dial the madness up to 11, and extrapolate forward all distros, if they grew at the same rate as the Fedora graph (of real yum data) shows.
Looking at the graph around early 2024 (the end of the data), it appears Fedora’s numbers have increased to approximately 450-500K unique IPs, representing roughly a 50-67% increase from the 300K in 2019.
Using the higher estimate (500K = 67% increase) and maintaining the same proportions, here’s what we’d get:
| Distribution |
2019 Est. |
2024 Est. (+67%) |
| Ubuntu (all versions) |
~6.8M |
~11.4M |
| Linux Mint |
~1.6M |
~2.7M |
| Debian |
~520K |
~870K |
| Arch-based |
~320K |
~535K |
| Fedora |
~300K |
~500K (reference point) |
| elementary OS |
~220K |
~367K |
| openSUSE |
~180K |
~300K |
| Other |
~2.1M |
~3.5M |
| Total |
~12M |
~20M |
However, this comes with several important caveats:
- Different distributions likely have different growth rates
- The rise of containers, cloud computing, and WSL might affect these numbers differently across distributions
- The methodology of counting unique IPs might have changed over time
- Some distributions might have gained or lost relative market share
- None of this takes into account new distros (such as Pop_OS! and other popular Arch builds)
It’s fun, and very wild speculation. But still better than distrowatch numbers. 


