Recently I have switched to fedora workstation and after three or four days everything was going fine I just make a dnf update and my PC is now updated to the kernel version 5.14 the latest that fedora offers but now when I start my PC loading os now takes more or less 4 to 5 minutes I thought there must be some issue regarding while updating my device so I I just simply make a clean install again with Fedora 34 but again I done a dnf update now again it is taking more than 4 minutes to 5 minute now I think there must be some issue in the updating system or fedora34 itself please make it correct because I want to to switch to Fedora in my work PC also.
Can you share the output of:
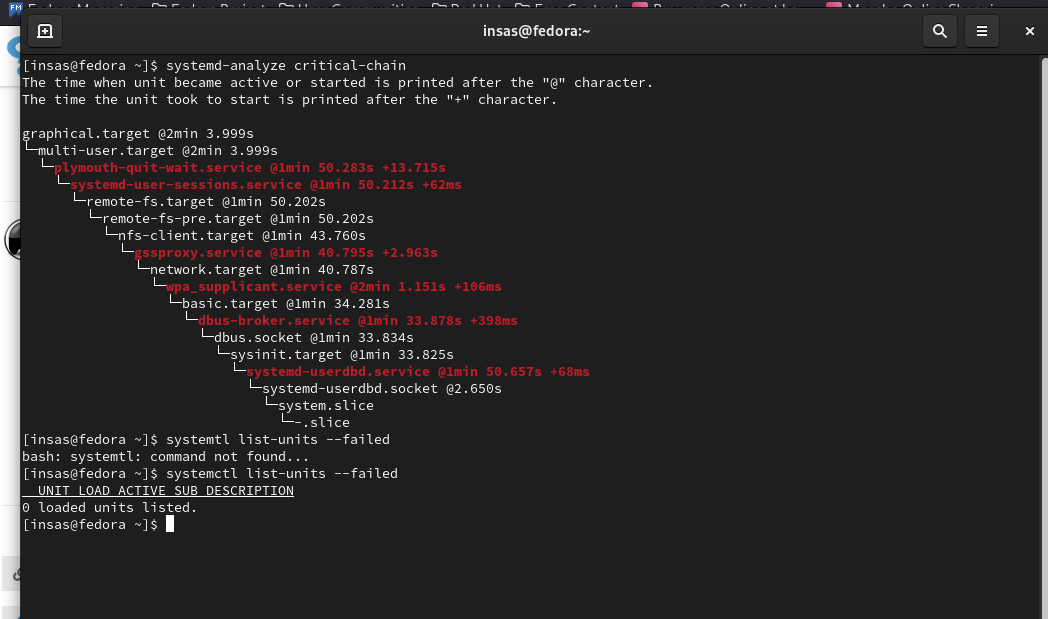
systemd-analyze critical-chain
and
systemctl list-units --failed
2 Likes
i dont know why this is happening i am new to linux i was using open suse tumbleweed and did not find this slow boot up issue and before that i was on arch base distro that was also fine debian base also tried. so kindly help
Please post the entire output of “systemd-analyze critical-chain” and not a screenshot. There is a lot of data in the part not shown in the screenshot, including some things that are contributing to more than a
1 1/2 minutes of time.
1 Like
Could you help me how can i send full systemd analysis i don’t know…and instead of screenshot how should i send those details should i copy paste it here…will it help.
graphical.target @2min 376ms
└─multi-user.target @2min 376ms
└─plymouth-quit-wait.service @1min 49.708s +10.666s
└─systemd-user-sessions.service @1min 49.664s +36ms
└─remote-fs.target @1min 49.655s
└─remote-fs-pre.target @1min 49.655s
└─nfs-client.target @1min 41.320s
└─gssproxy.service @1min 40.621s +697ms
└─network.target @1min 40.613s
└─wpa_supplicant.service @1min 57.876s +163ms
└─basic.target @1min 33.950s
└─dbus-broker.service @1min 33.576s +368ms
└─dbus.socket @1min 33.544s
└─sysinit.target @1min 33.525s
└─systemd-userdbd.service @1min 50.054s +74ms
└─systemd-userdbd.socket @2.532s
└─system.slice
└─-.slice
i got this report can you help me what i have to do next.
Paste the text within code tags that look like this.
[code]
paste the text from the screen here
[/code]
You can see the results of the way you posted it above, and here are my results in code tags.
# systemd-analyze critical-chain
The time when unit became active or started is printed after the "@" character.
The time the unit took to start is printed after the "+" character.

graphical.target @22.802s
└─multi-user.target @22.802s
  └─plymouth-quit-wait.service @15.504s +7.297s
    └─systemd-user-sessions.service @15.040s +4ms
      └─remote-fs.target @15.033s
        └─remote-fs-pre.target @15.032s
          └─nfs-client.target @8.684s
            └─gssproxy.service @8.306s +368ms
              └─network.target @8.302s
                └─wpa_supplicant.service @9.060s +19ms
                  └─dbus-broker.service @5.246s +1.086s
                    └─dbus.socket @5.158s
                      └─sysinit.target @5.152s
                        └─systemd-update-utmp.service @5.142s +9ms
                          └─auditd.service @5.033s +108ms
                            └─systemd-tmpfiles-setup.service @4.910s +119ms
                              └─import-state.service @4.887s +22ms
                                └─local-fs.target @4.886s
                                  └─var-lib-libvirt-images.mount @4.883s +2ms
                                    └─home.mount @4.794s +48ms
                                      └─systemd-fsck@dev-mapper-fedora_raid\x2dhome.service @4.428s +313ms
                                        └─local-fs-pre.target @4.425s
                                          └─lvm2-monitor.service @788ms +1.297s
                                            └─dm-event.socket @780ms
                                              └─system.slice
                                                └─-.slice
lines 7-29/29 (END)
Note that the line at the very bottom shows 29 lines were displayed and that it is at the (END). Scrolling is possible when copying the console text but not with a screen shot. I also show the command and all following text.
You can see from the screenshot above that the OP isn’t getting that END line. For reference, my Fedora 34 install also doesn’t display that line. I don’t think it matters though. The OPs screenshot and text above is complete as it is.
It looks like userdbd is taking 90+ seconds.
Interestingly, that is disabled on my install. Do you need it? If not, try disabling it and see if that helps.
what is that userdbd and my boot up was fast enough unless i made a dnf update it become slow now tell me how to stop that or delete that userdbd btw userdbd used for do you know.?
and now its look like it slows down even more

![]()
Can you look into my screenshot i didn’t figure it out it is still taking lots of time. Please help…

here is a screenshot of systemd-analyze can anyone tell me why it is so slow i was using it and all ware ok fast snappy but when i done a dnf update my device become slow extramly slow on boot up. as it is my now primary os i am having issues. and i dont have nvidia card it is my amd system
does anyone find a solution
did you try what was suggested by @dalto in post 8?
Yes it told me to disable it but i don’t known how to disable that and what is that and tell me how to disable it…
Oh poor me!! Hold my hand!!
You should try some searches and see what pops up. This helpless attitude is disappointing.
A quick google search for ‘how to disable systemd-userdbd.service’ gives almost 16,000 results and this is the first one.
done but what is this userdbd service do and use for but the issue was stated after dnf update and problem is still there
graphical.target @1min 58.203s
└─multi-user.target @1min 58.203s
└─plymouth-quit-wait.service @1min 47.589s +10.613s
└─systemd-user-sessions.service @1min 47.545s +36ms
└─remote-fs.target @1min 47.534s
└─remote-fs-pre.target @1min 47.534s
└─nfs-client.target @1min 40.442s
└─gssproxy.service @1min 40.100s +341ms
└─network.target @1min 40.093s
└─wpa_supplicant.service @1min 55.532s +197ms
└─basic.target @1min 34.100s
└─dbus-broker.service @1min 33.645s +450ms
└─dbus.socket @1min 33.610s
└─sysinit.target @1min 33.601s
└─systemd-update-utmp.service @1min 33.573s +28ms
└─auditd.service @1min 33.096s +473ms
└─systemd-tmpfiles-setup.service @1min 32.856s +2>
└─import-state.service @1min 32.672s +181ms
└─local-fs.target @1min 32.666s
└─tmp.mount @1min 32.658s +8ms
We would need to see the entire output of the “systemd-analyze critical-chain” command to see what occurred before the tmp.mount entry.
As suggested earlier it would be nice if you were to use code tags to retain formatting for easier readability. The entry is as simple as doing the following.
[code]
paste your text here
[/code]A search will help answer that.
graphical.target @2min 8.531s
└─multi-user.target @2min 8.530s
  └─plymouth-quit-wait.service @1min 54.831s +13.696s
    └─systemd-user-sessions.service @1min 54.805s +18ms
      └─remote-fs.target @1min 54.794s
        └─remote-fs-pre.target @1min 54.794s
          └─nfs-client.target @1min 48.059s
            └─gssproxy.service @1min 47.853s +204ms
              └─network.target @1min 47.845s
                └─wpa_supplicant.service @2min 5.856s +150ms
                  └─basic.target @1min 33.834s
                    └─dbus-broker.service @1min 33.456s +373ms
                      └─dbus.socket @1min 33.420s
                        └─sysinit.target @1min 33.411s
                          └─systemd-update-utmp.service @1min 33.381s +28ms
                            └─auditd.service @1min 32.927s +450ms
                              └─systemd-tmpfiles-setup.service @1min 32.657s +263ms
                                └─import-state.service @1min 32.506s +147ms
                                  └─local-fs.target @1min 32.501s
                                    └─tmp.mount @1min 32.492s +8ms
                                      └─systemd-journald.socket
                                        └─system.slice
└─-.sliceThe first thing there that shows the delay is tmp.mount.
Apparently something is delaying that by more than 1 1/2 minutes.
By default fedora uses ram for the tmpfs file system and /tmp. Are you using a physical drive/partition for /tmp? If so, is it local or remote or USB? There seems no reason for that long delay if it is ram as is default.
That time hangs until it reaches the network.target + gssproxy.service + nfs-client.service which implies the tmp.mount action is waiting for the network to be activated before tmp.mount can be activated.