Cannot boot; stuck in emergency mode, Volume group missing

Fedora version: 42

Basic info:

My HP Omen laptop has the following specs:

256GB NVME SSD drive
2 TB SSD Hard drive (Sandisk)

Its a dual boot configuration: Fedora 42 and Windows 10

The laptop originally came with 1TB Mechanical SATA disk drive (2.5 inch internal HDD). I upgraded it to a Sandisk 2TB SSD (2.5 inch) Hard drive two years back.

For faster performance, both Fedora and Windows OS are installed in the NVME drive.
Fedora OS runs from /dev/mapper/fedora_rootvg-root which is created in a NVME partition /dev/nvme0n1p7 as shown below.

To store my personal data, I use the 2 TB SSD disk I mentioned above. Fedora assigned the name /dev/sda for this drive.

For my personal data, I created the LV /dev/mapper/fedora_homevg-home which is created from PV /dev/sda3 as shown below.

/dev/mapper/fedora_homevg-home was mounted on mount point /home . This filesystem is currently missing. Details below.

/dev/mapper/fedora_rootvg-root was created from /dev/nvme0n1p7 and is mounted on /. This is currently working fine.

Everything has been running fine for the last 2 years since the SSD upgrade.

Following is an lsblk and df outputs, which I had captured few months back.
BUT, currently, lsblk output looks slightly different. Under ‘MOUNTPOINTS’ column, I see only /
Posted the screenshot at the bottom of this post.

## Output captured few months back

[sysadmin@localhost:/home/sysadmin]$ lsblk
NAME                   MAJ:MIN RM   SIZE RO TYPE MOUNTPOINTS
sda                      8:0    0   1.8T  0 disk 
├─sda1                   8:1    0 398.8G  0 part 
├─sda2                   8:2    0  11.1G  0 part 
└─sda3                   8:3    0   1.3T  0 part 
  ├─fedora_homevg-home 253:1    0   1.3T  0 lvm  /home
  └─fedora_homevg-tmp  253:2    0     8G  0 lvm  /tmp
zram0                  252:0    0     8G  0 disk [SWAP]
nvme0n1                259:0    0 238.5G  0 disk 
├─nvme0n1p1            259:1    0   260M  0 part 
├─nvme0n1p2            259:2    0    16M  0 part 
├─nvme0n1p3            259:3    0 132.2G  0 part 
├─nvme0n1p4            259:4    0   980M  0 part 
├─nvme0n1p5            259:5    0   512M  0 part /boot/efi
├─nvme0n1p6            259:6    0     1G  0 part /boot
└─nvme0n1p7            259:7    0   102G  0 part 
  └─fedora_rootvg-root 253:0    0   102G  0 lvm  /
[sysadmin@localhost:/home/sysadmin]$

[sysadmin@localhost:/home/sysadmin]$ df -Th
Filesystem                     Type      Size  Used Avail Use% Mounted on
devtmpfs                       devtmpfs  4.0M     0  4.0M   0% /dev
tmpfs                          tmpfs      16G  7.7M   16G   1% /dev/shm
tmpfs                          tmpfs     6.3G  2.1M  6.3G   1% /run
/dev/mapper/fedora_rootvg-root ext4      100G   39G   57G  41% /
/dev/nvme0n1p6                 ext4      974M  281M  626M  31% /boot
/dev/mapper/fedora_homevg-tmp  ext4      7.8G   58M  7.4G   1% /tmp
/dev/nvme0n1p5                 vfat      511M   18M  494M   4% /boot/efi
/dev/mapper/fedora_homevg-home ext4      1.3T  555G  688G  45% /home
tmpfs                          tmpfs     3.2G  3.8M  3.2G   1% /run/user/1000
[sysadmin@localhost:/home/sysadmin]$ 

One month back, I remember getting a notification of some kind of disk related warning from Fedora. But, I ignored it.

Last night, when I switched on my laptop, it won’t boot. It is stuck in the emergency mode and I get the following message.

You are in the emergency mode. After logging in, type “journalctl -xb” to view system logs, “systemctl reboot” to reboot, or “exit” to continue boot up.

Cannot open access to console, the root account is locked.
See sulogin(8) man page for more details.

Press enter to continue.

Following is what I see when I try to login to rescue mode thing in Grub.


Later, I managed to log into bash terminal using the method used by this guy, i.e. by adding init=/bin/bash to grub

Although I get to login as root, I cannot edit /etc/fstab. I will come to this later.

After, I login, I can manually mount /boot and /boot/efi using the following. Don’t know why Fedora can’t do this during boot.

# mount /boot

# mount /boot/efi

and the following can be seen in df output

/dev/nvme0n1p6                 ext4      974M  281M  626M  31% /boot
/dev/nvme0n1p5                 vfat      511M   18M  494M   4% /boot/efi

The missing Volume group

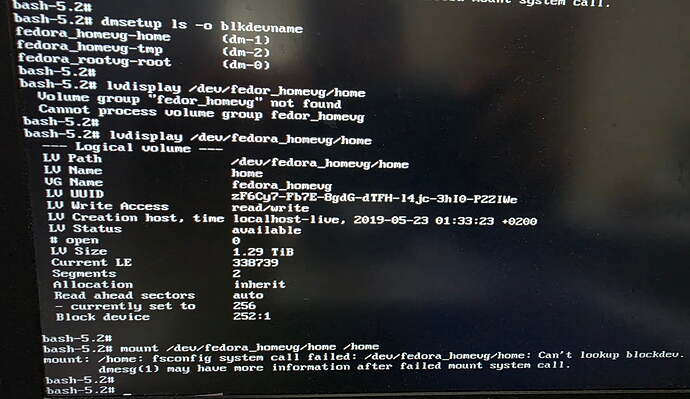
I tried to mount /home (/dev/mapper/fedora_homevg-home). But, I noticed that logical volue fedora_homevg-home is missing in /dev/mapper location.

Then, from googling, I learnt that, it originally is located in a different path, which is /dev/fedora_homevg/home

So, I ran the following to activate the Volume groups

# vgscan        ## scan for volume groups

# vgchange -a y ## activates the volume groups

Although vgchange output shows that volume group /dev/fedora_homevg has become ‘active’ now, I cannot see it in /dev path. See output below.

vgs also lists fedora_homevg . See the bottom of the above screenshot

Logical volume /dev/fedora_homevg/home (the real path, not the /dev/devmapper one) also seems to be displayed in lvdisplay. But, it is physically not present in /dev as the volume group /dev/fedora_homevg itself is not present.

Question1. Any idea what needs to be done to physically bring volume group fedora_homevg in /dev path ? And eventually in /dev/mapper

Question2. Is it my NVME drive that is broken or my SSD drive ?

Question3. Any idea why /boot and /boot/efi is not mounted during boot ?

Question4. Using the method I learnt from the youtube video mentioned above (using init=/bin/bash), I managed to login to bash as root.
But, I cannot edit /etc/fstab file. I have a created live USB of Fedora 42. Can the live USB help me in anyway here ?

Following is my /etc/fstab and current lsblk output. As you can see in lsblk output Under ‘MOUNTPOINTS’ column, only / is visible

I see a one thing that possibly lead up to your problem.

  1. You noted that you received a disk warning but IGNORED it. That was the beginning.

A user should never ignore a warning about the drive. It may be a simple error or it may be the beginning of a total failure.

Since this appears to be a drive issue there are a few things to do in an attempt to recover.

First check the file system of /home for damages. This MUST be done with the file system unmounted and is easiest if done by booting using a live media for booting.
First run sudo fsck.<filesystem type> -f /dev/mapper/fedora_homevg-home. You can use e2fsck if the file system is ext4 otherwise there are several alternative file system types that can substitute for the ‘filesystem type’ in that command. If btrfs then there are alternative methods of checking file system integrity.

Once the file system has been confirmed clean then it is time to check the hardware status. Use sudo smartctl -x /dev/sda to get a full report of the drive physical status. If you post the output here we should be able to tell you if there are reasons for concern.

The actual cause of not booting would seem to be that the VG containing /home did not become available. Whether that was hardware or file system related is what the tests above are intended to identify.

1 Like

Thank You very much, Jeff.

With Fedora 42 Live USB, I was able to run

sudo fsck.ext4 -f /dev/mapper/fedora_homevg-home

This fixed all the issues with /dev/mapper/fedora_homevg-home and now I can boot without any issues !

When I was logging into bash terminal as root using the method mentioned the above youtube video (type e at grub line plus adding init=/bin/bash), /dev/mapper/fedora_homevg-home was not visible but /dev/mapper/fedora_homevg-home created from /dev/nvme0n1p7 was visible.

So, I thought Fedora Live USB won’t be able to see /dev/mapper/fedora_homevg-home either. I was wrong.
Live USB can see it and I was able to run fsck on it.

Question1. So, fsck can be run only on Logical volume (Eg /dev/mapper/fedora_homevg-home) and not the underlying volume group (like /dev/fedora_homevg) or the underlying PV (/dev/sdba3) ?

Question 2. Below are the errors from fsck. Are these errors caused at the hardware level or some Linux internal thing ?

On the ‘page 1’ of the terminal, I remember pressing Y for prompts related to repairing inodes.
Sample screenshot provided below.
Before I could take a picture, the messages went to the next page and I couldn’t scroll up.

$ sudo fsck.ext4 -f /dev/mapper/fedora_homevg-home
<snipped>

Pass 1: Checking inodes, blocks, and sizes
Inodes that were part of a corrupted orphan linked list found. Fix? yes
.
.

Second page of fsck command output shown below.

Output of sudo smartctl -x /dev/sda shown. I think this is the second page (I couldn’t scroll up to the first page)

Thank again !

Had you run those commands from a terminal window in the live usb gui you would have been able to scroll the results. From single user mode (reached by booting with init=/bin/bash) the tty prevents scrollback.

Q1 The file system exists on the LV. That means fsck must be run on the LV (/dev/mapper/fedora_homevg-home)

Q2 FSCK errors are file system related and can be caused by hardware errors. The most common cause though is either power fluctuations or user actions.

To determine if this is hardware related please run the smartctl -x /dev/sda command in a terminal window and paste the entire output here as preformatted text (highlight the text after pasting and click the </> button)

User action can be powering off (power loss or pressing the power button) while the drive is actively writing something. Forcibly interrupting a process that is attempting to write. A software crash, or other things

1 Like

Oh ok.
Roughly, once every 2 to 3 weeks, my Fedora hangs, which I think has something to do with gnome.
So, I will have to press the power button and restart. And when it hangs, I cannot even login to that tty thing using CTRL+ALT+F3, so that I can do a graceful shutdown.

These abrupt power failures may have caused some issues in /dev/sda3, the underlying PV for /dev/mapper/fedora_homevg-home

Here is the full output of smartctl -x /dev/sda

[sysadmin@localhost:/home/sysadmin]$ sudo smartctl -x /dev/sda
[sudo] password for sysadmin: 
smartctl 7.5 2025-04-30 r5714 [x86_64-linux-6.16.3-200.fc42.x86_64] (local build)
Copyright (C) 2002-25, Bruce Allen, Christian Franke, www.smartmontools.org

=== START OF INFORMATION SECTION ===
Device Model:     SD Ultra 3D 2TB
Serial Number:    23152M446606
LU WWN Device Id: 5 001b44 4a58cb4a3
Firmware Version: 530309WD
User Capacity:    2,000,398,934,016 bytes [2.00 TB]
Sector Size:      512 bytes logical/physical
Rotation Rate:    Solid State Device
Form Factor:      2.5 inches
TRIM Command:     Available, deterministic, zeroed
Device is:        Not in smartctl database 7.5/5706
ATA Version is:   ACS-3 T13/2161-D revision 5
SATA Version is:  SATA 3.3, 6.0 Gb/s (current: 6.0 Gb/s)
Local Time is:    Sat Aug 30 21:03:12 2025 CEST
SMART support is: Available - device has SMART capability.
SMART support is: Enabled
AAM feature is:   Unavailable
APM level is:     254 (maximum performance)
Rd look-ahead is: Enabled
Write cache is:   Enabled
DSN feature is:   Unavailable
ATA Security is:  Disabled, frozen [SEC2]

=== START OF READ SMART DATA SECTION ===
SMART overall-health self-assessment test result: PASSED

General SMART Values:
Offline data collection status:  (0x80)	Offline data collection activity
					was never started.
					Auto Offline Data Collection: Enabled.
Self-test execution status:      (   0)	The previous self-test routine completed
					without error or no self-test has ever 
					been run.
Total time to complete Offline 
data collection: 		(    0) seconds.
Offline data collection
capabilities: 			 (0x7b) SMART execute Offline immediate.
					Auto Offline data collection on/off support.
					Suspend Offline collection upon new
					command.
					Offline surface scan supported.
					Self-test supported.
					Conveyance Self-test supported.
					Selective Self-test supported.
SMART capabilities:            (0x0002)	Does not save SMART data before
					entering power-saving mode.
					Supports SMART auto save timer.
Error logging capability:        (0x01)	Error logging supported.
					General Purpose Logging supported.
Short self-test routine 
recommended polling time: 	 (   2) minutes.
Extended self-test routine
recommended polling time: 	 (   2) minutes.
Conveyance self-test routine
recommended polling time: 	 (   3) minutes.
SCT capabilities: 	       (0x0035)	SCT Status supported.
					SCT Feature Control supported.
					SCT Data Table supported.

SMART Attributes Data Structure revision number: 16
Vendor Specific SMART Attributes with Thresholds:
ID# ATTRIBUTE_NAME          FLAGS    VALUE WORST THRESH FAIL RAW_VALUE
  5 Reallocated_Sector_Ct   -O--CK   100   100   000    -    259
  9 Power_On_Hours          -O--CK   100   100   000    -    3827
 12 Power_Cycle_Count       -O--CK   100   100   000    -    1399
165 Unknown_Attribute       -O--CK   100   100   000    -    69
166 Unknown_Attribute       -O--CK   100   100   000    -    2
167 Unknown_Attribute       -O--CK   100   100   000    -    119
168 Unknown_Attribute       -O--CK   100   100   000    -    81
170 Unknown_Attribute       -O--CK   100   100   000    -    259
171 Unknown_Attribute       -O--CK   100   100   000    -    0
172 Unknown_Attribute       -O--CK   100   100   000    -    0
173 Unknown_Attribute       -O--CK   100   100   000    -    21
174 Unknown_Attribute       -O--CK   100   100   000    -    88
187 Reported_Uncorrect      -O--CK   100   100   000    -    0
188 Command_Timeout         -O--CK   100   100   000    -    0
194 Temperature_Celsius     -O--CK   100   100   000    -    38 (Min/Max 10/70)
199 UDMA_CRC_Error_Count    -O--CK   100   100   000    -    1
230 Unknown_SSD_Attribute   -O--CK   100   100   000    -    0
232 Available_Reservd_Space PO--CK   100   100   001    -    84
233 Media_Wearout_Indicator -O--CK   100   100   000    -    44084
234 Unknown_Attribute       -O--CK   100   100   000    -    688
241 Total_LBAs_Written      -O--CK   100   100   000    -    6644
242 Total_LBAs_Read         -O--CK   100   100   000    -    3937
244 Unknown_Attribute       -O--CK   100   100   000    -    0
                            ||||||_ K auto-keep
                            |||||__ C event count
                            ||||___ R error rate
                            |||____ S speed/performance
                            ||_____ O updated online
                            |______ P prefailure warning

General Purpose Log Directory Version 1
SMART           Log Directory Version 1 [multi-sector log support]
Address    Access  R/W   Size  Description
0x00       GPL,SL  R/O      1  Log Directory
0x01           SL  R/O      1  Summary SMART error log
0x03       GPL     R/O      1  Ext. Comprehensive SMART error log
0x04       GPL,SL  R/O      8  Device Statistics log
0x06           SL  R/O      1  SMART self-test log
0x07       GPL     R/O      1  Extended self-test log
0x09           SL  R/W      1  Selective self-test log
0x10       GPL     R/O      1  NCQ Command Error log
0x11       GPL     R/O      1  SATA Phy Event Counters log
0x24       GPL     R/O     88  Current Device Internal Status Data log
0x25       GPL     R/O     64  Saved Device Internal Status Data log
0x30       GPL,SL  R/O      9  IDENTIFY DEVICE data log
0x80-0x9f  GPL,SL  R/W     16  Host vendor specific log
0xe0       GPL,SL  R/W      1  SCT Command/Status
0xe1       GPL,SL  R/W      1  SCT Data Transfer

SMART Extended Comprehensive Error Log Version: 1 (1 sectors)
No Errors Logged

SMART Extended Self-test Log Version: 1 (1 sectors)
No self-tests have been logged.  [To run self-tests, use: smartctl -t]

SMART Selective self-test log data structure revision number 1
 SPAN  MIN_LBA  MAX_LBA  CURRENT_TEST_STATUS
    1        0        0  Not_testing
    2        0        0  Not_testing
    3        0        0  Not_testing
    4        0        0  Not_testing
    5        0        0  Completed [00% left] (0-65535)
Selective self-test flags (0x0):
  After scanning selected spans, do NOT read-scan remainder of disk.
If Selective self-test is pending on power-up, resume after 0 minute delay.

SCT Status Version:                  3
SCT Version (vendor specific):       1 (0x0001)
Device State:                        Active (0)
Current Temperature:                    38 Celsius
Power Cycle Min/Max Temperature:     24/45 Celsius
Lifetime    Min/Max Temperature:     10/70 Celsius
Under/Over Temperature Limit Count:   0/0

SCT Temperature History Version:     2
Temperature Sampling Period:         1 minute
Temperature Logging Interval:        1 minute
Min/Max recommended Temperature:      0/100 Celsius
Min/Max Temperature Limit:            0/100 Celsius
Temperature History Size (Index):    128 (3)

Index    Estimated Time   Temperature Celsius
   4    2025-08-30 18:56     ?  -
   5    2025-08-30 18:57    37  ******************
   6    2025-08-30 18:58    35  ****************
   7    2025-08-30 18:59    33  **************
 ...    ..(  2 skipped).    ..  **************
  10    2025-08-30 19:02    33  **************
  11    2025-08-30 19:03    34  ***************
  12    2025-08-30 19:04    35  ****************
  13    2025-08-30 19:05    38  *******************
  14    2025-08-30 19:06    37  ******************
  15    2025-08-30 19:07    36  *****************
  16    2025-08-30 19:08    30  ***********
  17    2025-08-30 19:09     ?  -
  18    2025-08-30 19:10    35  ****************
  19    2025-08-30 19:11    38  *******************
  20    2025-08-30 19:12    40  *********************
  21    2025-08-30 19:13    38  *******************
  22    2025-08-30 19:14    39  ********************
  23    2025-08-30 19:15    42  ***********************
  24    2025-08-30 19:16     ?  -
  25    2025-08-30 19:17    31  ************
  26    2025-08-30 19:18     ?  -
  27    2025-08-30 19:19    24  *****
  28    2025-08-30 19:20    33  **************
  29    2025-08-30 19:21    42  ***********************
  30    2025-08-30 19:22    42  ***********************
  31    2025-08-30 19:23    42  ***********************
  32    2025-08-30 19:24    38  *******************
  33    2025-08-30 19:25    37  ******************
  34    2025-08-30 19:26    37  ******************
  35    2025-08-30 19:27    37  ******************
  36    2025-08-30 19:28    38  *******************
  37    2025-08-30 19:29    40  *********************
  38    2025-08-30 19:30    37  ******************
  39    2025-08-30 19:31    39  ********************
  40    2025-08-30 19:32    39  ********************
  41    2025-08-30 19:33    39  ********************
  42    2025-08-30 19:34    37  ******************
  43    2025-08-30 19:35    37  ******************
  44    2025-08-30 19:36    37  ******************
  45    2025-08-30 19:37    38  *******************
  46    2025-08-30 19:38    38  *******************
  47    2025-08-30 19:39    40  *********************
  48    2025-08-30 19:40    37  ******************
  49    2025-08-30 19:41    37  ******************
  50    2025-08-30 19:42    39  ********************
  51    2025-08-30 19:43    38  *******************
  52    2025-08-30 19:44    38  *******************
  53    2025-08-30 19:45    37  ******************
  54    2025-08-30 19:46    38  *******************
  55    2025-08-30 19:47    37  ******************
  56    2025-08-30 19:48    38  *******************
  57    2025-08-30 19:49    37  ******************
  58    2025-08-30 19:50    37  ******************
  59    2025-08-30 19:51    37  ******************
  60    2025-08-30 19:52    39  ********************
  61    2025-08-30 19:53    39  ********************
  62    2025-08-30 19:54    37  ******************
  63    2025-08-30 19:55    38  *******************
  64    2025-08-30 19:56    39  ********************
  65    2025-08-30 19:57    37  ******************
  66    2025-08-30 19:58    39  ********************
 ...    ..(  2 skipped).    ..  ********************
  69    2025-08-30 20:01    39  ********************
  70    2025-08-30 20:02    37  ******************
  71    2025-08-30 20:03    39  ********************
  72    2025-08-30 20:04    37  ******************
  73    2025-08-30 20:05    39  ********************
  74    2025-08-30 20:06    45  **************************
  75    2025-08-30 20:07    38  *******************
  76    2025-08-30 20:08    39  ********************
  77    2025-08-30 20:09    40  *********************
  78    2025-08-30 20:10    37  ******************
  79    2025-08-30 20:11    37  ******************
  80    2025-08-30 20:12    39  ********************
  81    2025-08-30 20:13    39  ********************
  82    2025-08-30 20:14    39  ********************
  83    2025-08-30 20:15    38  *******************
  84    2025-08-30 20:16    37  ******************
  85    2025-08-30 20:17    37  ******************
  86    2025-08-30 20:18    37  ******************
  87    2025-08-30 20:19    38  *******************
  88    2025-08-30 20:20    37  ******************
  89    2025-08-30 20:21    37  ******************
  90    2025-08-30 20:22    37  ******************
  91    2025-08-30 20:23    38  *******************
  92    2025-08-30 20:24    37  ******************
  93    2025-08-30 20:25    37  ******************
  94    2025-08-30 20:26    38  *******************
  95    2025-08-30 20:27    38  *******************
  96    2025-08-30 20:28    38  *******************
  97    2025-08-30 20:29    39  ********************
  98    2025-08-30 20:30    37  ******************
  99    2025-08-30 20:31    37  ******************
 100    2025-08-30 20:32    38  *******************
 101    2025-08-30 20:33    38  *******************
 102    2025-08-30 20:34    38  *******************
 103    2025-08-30 20:35    37  ******************
 104    2025-08-30 20:36    38  *******************
 105    2025-08-30 20:37    38  *******************
 106    2025-08-30 20:38    37  ******************
 107    2025-08-30 20:39    37  ******************
 108    2025-08-30 20:40    38  *******************
 109    2025-08-30 20:41    39  ********************
 110    2025-08-30 20:42    37  ******************
 111    2025-08-30 20:43    37  ******************
 112    2025-08-30 20:44    38  *******************
 113    2025-08-30 20:45    37  ******************
 114    2025-08-30 20:46    38  *******************
 115    2025-08-30 20:47    38  *******************
 116    2025-08-30 20:48    38  *******************
 117    2025-08-30 20:49    37  ******************
 118    2025-08-30 20:50    37  ******************
 119    2025-08-30 20:51    37  ******************
 120    2025-08-30 20:52    38  *******************
 121    2025-08-30 20:53    37  ******************
 122    2025-08-30 20:54    37  ******************
 123    2025-08-30 20:55    38  *******************
 124    2025-08-30 20:56    38  *******************
 125    2025-08-30 20:57    37  ******************
 126    2025-08-30 20:58    38  *******************
 127    2025-08-30 20:59    37  ******************
   0    2025-08-30 21:00    38  *******************
   1    2025-08-30 21:01    37  ******************
   2    2025-08-30 21:02    38  *******************
   3    2025-08-30 21:03    40  *********************

SCT Error Recovery Control command not supported

Device Statistics (GP Log 0x04)
Page  Offset Size        Value Flags Description
0x01  =====  =               =  ===  == General Statistics (rev 1) ==
0x01  0x008  4            1399  ---  Lifetime Power-On Resets
0x01  0x010  4            3827  ---  Power-on Hours
0x01  0x018  6      1049843448  ---  Logical Sectors Written
0x01  0x020  6       237226537  ---  Number of Write Commands
0x01  0x028  6      3963517088  ---  Logical Sectors Read
0x01  0x030  6       241572394  ---  Number of Read Commands
0x01  0x038  6       894536313  ---  Date and Time TimeStamp
0x04  =====  =               =  ===  == General Errors Statistics (rev 1) ==
0x04  0x008  4               0  ---  Number of Reported Uncorrectable Errors
0x04  0x010  4              94  ---  Resets Between Cmd Acceptance and Completion
0x05  =====  =               =  ===  == Temperature Statistics (rev 1) ==
0x05  0x008  1              38  ---  Current Temperature
0x05  0x010  1              36  ---  Average Short Term Temperature
0x05  0x018  1              36  ---  Average Long Term Temperature
0x05  0x020  1              70  ---  Highest Temperature
0x05  0x028  1              10  ---  Lowest Temperature
0x05  0x030  1              64  ---  Highest Average Short Term Temperature
0x05  0x038  1               0  ---  Lowest Average Short Term Temperature
0x05  0x040  1              58  ---  Highest Average Long Term Temperature
0x05  0x048  1               0  ---  Lowest Average Long Term Temperature
0x05  0x050  4             220  ---  Time in Over-Temperature
0x05  0x058  1              65  ---  Specified Maximum Operating Temperature
0x05  0x060  4               0  ---  Time in Under-Temperature
0x05  0x068  1               0  ---  Specified Minimum Operating Temperature
0x06  =====  =               =  ===  == Transport Statistics (rev 1) ==
0x06  0x008  4            5486  ---  Number of Hardware Resets
0x06  0x010  4              17  ---  Number of ASR Events
0x06  0x018  4               1  ---  Number of Interface CRC Errors
0x07  =====  =               =  ===  == Solid State Device Statistics (rev 1) ==
0x07  0x008  1               0  ---  Percentage Used Endurance Indicator
                                |||_ C monitored condition met
                                ||__ D supports DSN
                                |___ N normalized value

Pending Defects log (GP Log 0x0c) not supported

SATA Phy Event Counters (GP Log 0x11)
ID      Size     Value  Description
0x0001  2            0  Command failed due to ICRC error
0x0002  2            0  R_ERR response for data FIS
0x0003  2            0  R_ERR response for device-to-host data FIS
0x0004  2            0  R_ERR response for host-to-device data FIS
0x0005  2            0  R_ERR response for non-data FIS
0x0006  2            0  R_ERR response for device-to-host non-data FIS
0x0007  2            0  R_ERR response for host-to-device non-data FIS
0x0008  2            0  Device-to-host non-data FIS retries
0x0009  2            0  Transition from drive PhyRdy to drive PhyNRdy
0x000a  2           16  Device-to-host register FISes sent due to a COMRESET
0x000b  2            0  CRC errors within host-to-device FIS
0x000d  2            0  Non-CRC errors within host-to-device FIS
0x000f  2            0  R_ERR response for host-to-device data FIS, CRC
0x0010  2            0  R_ERR response for host-to-device data FIS, non-CRC
0x0012  2            0  R_ERR response for host-to-device non-data FIS, CRC
0x0013  2            0  R_ERR response for host-to-device non-data FIS, non-CRC

[sysadmin@localhost:/home/sysadmin]$

BTW, this is my Sandisk (Western Digital) SSD Drive which I purchased 2 years back

Abrupt power losses and system freezes can definitely trigger problems in the file system. I doubt that it has anything to do with the hardware (sda) but seems file system and OS related only. The system freezes are the thing that you probably should address immediately. Failing to fix that will continue to cause other problems that will only get worse over time.

You marked this thread as solved so I suggest you open a new thread about the repeated freezes and someone can look at your logs with you to try and identify the cause and solution.

One additional thing I would suggest that you do immediately would be to run sudo dnf distro-sync --refresh to ensure the entire system is fully up to date with the repos and see what the result is after that.

I do note that sda has had severe swings in temps and wonder if this may be at least in part related to air flow and cooling in the case.

1 Like

Here is output of $ sudo dnf distro-sync --refresh

[sysadmin@localhost:/home/sysadmin]$ sudo dnf distro-sync --refresh
[sudo] password for sysadmin: 
Updating and loading repositories:
 Copr repo for PyCharm owned by phracek                                                                   100% | 995.0   B/s |   2.1 KiB |  00m02s
 Adobe Systems Incorporated                                                                               100% |   1.3 KiB/s |   2.9 KiB |  00m02s
 Visual Studio Code                                                                                       100% | 712.0   B/s |   1.5 KiB |  00m02s
 vivaldi                                                                                                  100% |   1.4 KiB/s |   3.0 KiB |  00m02s
 RPM Fusion for Fedora 42 - Free                                                                          100% |   2.4 KiB/s |   9.0 KiB |  00m04s
 TeamViewer - x86_64                                                                                      100% |   1.7 KiB/s |   3.5 KiB |  00m02s
 RPM Fusion for Fedora 42 - Nonfree                                                                       100% |   2.6 KiB/s |   9.2 KiB |  00m04s
 RPM Fusion for Fedora 42 - Nonfree - Updates                                                             100% |   2.4 KiB/s |   8.1 KiB |  00m03s
 RPM Fusion for Fedora 42 - Nonfree - Steam                                                               100% |   2.5 KiB/s |   8.3 KiB |  00m03s
 RPM Fusion for Fedora 42 - Nonfree - NVIDIA Driver                                                       100% |   2.7 KiB/s |   8.3 KiB |  00m03s
 Fedora 42 - x86_64 - VirtualBox                                                                          100% |   1.9 KiB/s |   3.8 KiB |  00m02s
 created by dnf config-manager from https://packages.microsoft.com/yumrepos/edge                          100% | 934.0   B/s |   1.5 KiB |  00m02s
 microsoft-edge                                                                                           100% | 948.0   B/s |   1.5 KiB |  00m02s
 RPM Fusion for Fedora 42 - Free - Updates                                                                100% |   2.9 KiB/s |   8.3 KiB |  00m03s
 Fedora 42 openh264 (From Cisco) - x86_64                                                                 100% | 370.0   B/s | 986.0   B |  00m03s
 Fedora 42 - x86_64                                                                                       100% |  10.8 KiB/s |  26.5 KiB |  00m02s
 created by dnf config-manager from https://brave-browser-rpm-release.s3.brave.com/x86_64/                100% |   1.2 KiB/s |   2.0 KiB |  00m02s
 Adoptium                                                                                                 100% |   1.1 KiB/s |   1.7 KiB |  00m02s
 google-chrome                                                                                            100% |   1.0 KiB/s |   1.3 KiB |  00m01s
 Fedora 42 - x86_64 - Updates                                                                             100% |   3.5 KiB/s |   8.0 KiB |  00m02s
 Atom Editor                                                                                              100% |   5.0   B/s |  64.0   B |  00m12s
>>> Status code: 402 for https://packagecloud.io/AtomEditor/atom/el/7/x86_64/repodata/repomd.xml (IP: 2600:1f1c:2e5:6901:3fdd:d24b:b26a:3811) - ht
>>> Usable URL not found                                                                                                                          
Repositories loaded.
Nothing to do.
[sysadmin@localhost:/home/sysadmin]$

About the swings in temperature for /dev/sda (my 2 TB SSD drive).
I guess this is what you meant.

In the smartctl -x /dev/sda output, I see the following as the peak (45 degree celcius); I ran it again now, and I saw a peak of 48 degree celcius.

74 2025-08-30 20:06 45 **************************

And at the bottom of smartctl -x /dev/sda output, I see the following. So, at some point in the past, the SSD drive was 70 degree celcius hot.

0x05  =====  =               =  ===  == Temperature Statistics (rev 1) ==
0x05  0x008  1              38  ---  Current Temperature
0x05  0x010  1              36  ---  Average Short Term Temperature
0x05  0x018  1              36  ---  Average Long Term Temperature
0x05  0x020  1              70  ---  Highest Temperature
0x05  0x028  1              10  ---  Lowest Temperature
0x05  0x030  1              64  ---  Highest Average Short Term Temperature
0x05  0x038  1               0  ---  Lowest Average Short Term Temperature
0x05  0x040  1              58  ---  Highest Average Long Term Temperature
0x05  0x048  1               0  ---  Lowest Average Long Term Temperature
0x05  0x050  4             220  ---  Time in Over-Temperature
0x05  0x058  1              65  ---  Specified Maximum Operating Temperature
0x05  0x060  4               0  ---  Time in Under-Temperature
0x05  0x068  1               0  ---  Specified Minimum Operating Temperature

I will have to do some cleaning (dusting) on the fans and air vents of the laptop.

Despite not being a gamer, the reason I bought a gaming laptop (HP Omen) is that usually they come with good cooling. Well, next time, I am going to buy a desktop PC which is compact but with good cooling system and air flow.

Actually I was looking at this for the temps

 
Index    Estimated Time   Temperature Celsius
   4    2025-08-30 18:56     ?  -
   5    2025-08-30 18:57    37  ******************
   6    2025-08-30 18:58    35  ****************
   7    2025-08-30 18:59    33  **************
 ...    ..(  2 skipped).    ..  **************
  10    2025-08-30 19:02    33  **************
  11    2025-08-30 19:03    34  ***************
  12    2025-08-30 19:04    35  ****************
  13    2025-08-30 19:05    38  *******************
  14    2025-08-30 19:06    37  ******************
  15    2025-08-30 19:07    36  *****************
  16    2025-08-30 19:08    30  ***********
  17    2025-08-30 19:09     ?  -
  18    2025-08-30 19:10    35  ****************
  19    2025-08-30 19:11    38  *******************
  20    2025-08-30 19:12    40  *********************
  21    2025-08-30 19:13    38  *******************
  22    2025-08-30 19:14    39  ********************
  23    2025-08-30 19:15    42  ***********************
  24    2025-08-30 19:16     ?  -
  25    2025-08-30 19:17    31  ************
  26    2025-08-30 19:18     ?  -
  27    2025-08-30 19:19    24  *****
  28    2025-08-30 19:20    33  **************
  29    2025-08-30 19:21    42  ***********************
  30    2025-08-30 19:22    42  ***********************
  31    2025-08-30 19:23    42  ***********************

Since this is a laptop it is quite important that the bottom is never blocked to prevent air flow. In fact most laptop coolers are designed to raise the machine off the surface and provide additional fans to assist the air cooling. Setting the laptop on a hard flat surface is usually OK but a on lap or other soft surfaces such as on bed is usually not a good choice.

My laptop draws air in on the bottom and pushes it out at the back.

Computers are designed to fail safe if possible, and sudden wide temp swings can cause erratic behavior, including a complete shutdown (power off crash) if the CPU exceeds the setpoint (usually 100c). When I had a water cooler pump failure on my desktop it would turn on and even watching the temps with gkrellm I could not see the spikes but the cpu would overheat and shutdown in mere seconds.

I have had my laptop for several years and only once have I needed to open the case and clean the air flow passages inside.

1 Like